Hi, I’m Felix! Welcome to this week’s ADPList’s Newsletter; 🔒 subscriber-only edition 🔒 weekly advice column. I write high-quality insights on designing products people love and leadership in tech. If you’re interested in sponsoring us, let’s chat!
This post is brought to you by Olvy: An AI-powered customer feedback management tool designed for PMs and UXRs to understand their customers' needs at scale. Try for free today!
We just crossed over 200K+ readers! TLDR: I’m adding a paid subscription plan!
This newsletter was always a little side-project for ADPList, but as we grow and after so much positive feedback, I’ve decided to take this into the longer-term ecosystem of ADPList to sustain our mission—to bring access to trusted knowledge by experts, to the world! 🎉
Starting in two weeks, only paid subscribers will get this newsletter weekly. In addition, paid subscriber questions will be prioritized, plus they’ll get exclusive goodies. Free subscribers will now receive this newsletter only about once a month!
✨ To thank you for being an early supporter, subscribe in the next 48 hours and get 25% off for the first year — just $59, or $4.90/month ✨
Now with all that great news, let’s get started. (More goodies at the end)!
A guide on data-informed design even when you have no data (or too much data).
Last week, I wrote a LinkedIn post on how designers overestimate their opinions. Many designers/design leaders had things to say. Today, this is for those of you wanting to design with data into your strategies; this piece is tailored just for you.
Perhaps you're gearing up for a product launch or revamping an existing service. Or perhaps your day-to-day involves consulting or freelancing, each new project bringing a fresh client and unique challenges. Questions like… 👀 What's essential to grasp business and consumer perspectives? How do you gauge success? And what insights do you need to refine your designs continuously?
This week’s post aims to unpack five common dilemmas you might face when integrating quantitative data into your design process. As we interviewed Julie Zhuo (Former VP of Design, Meta), I’m here to share actionable insights that will benefit designers beginning to navigate the intricacies of data-informed design.
“Diagnose with data, treat with design” — Julie Zhuo
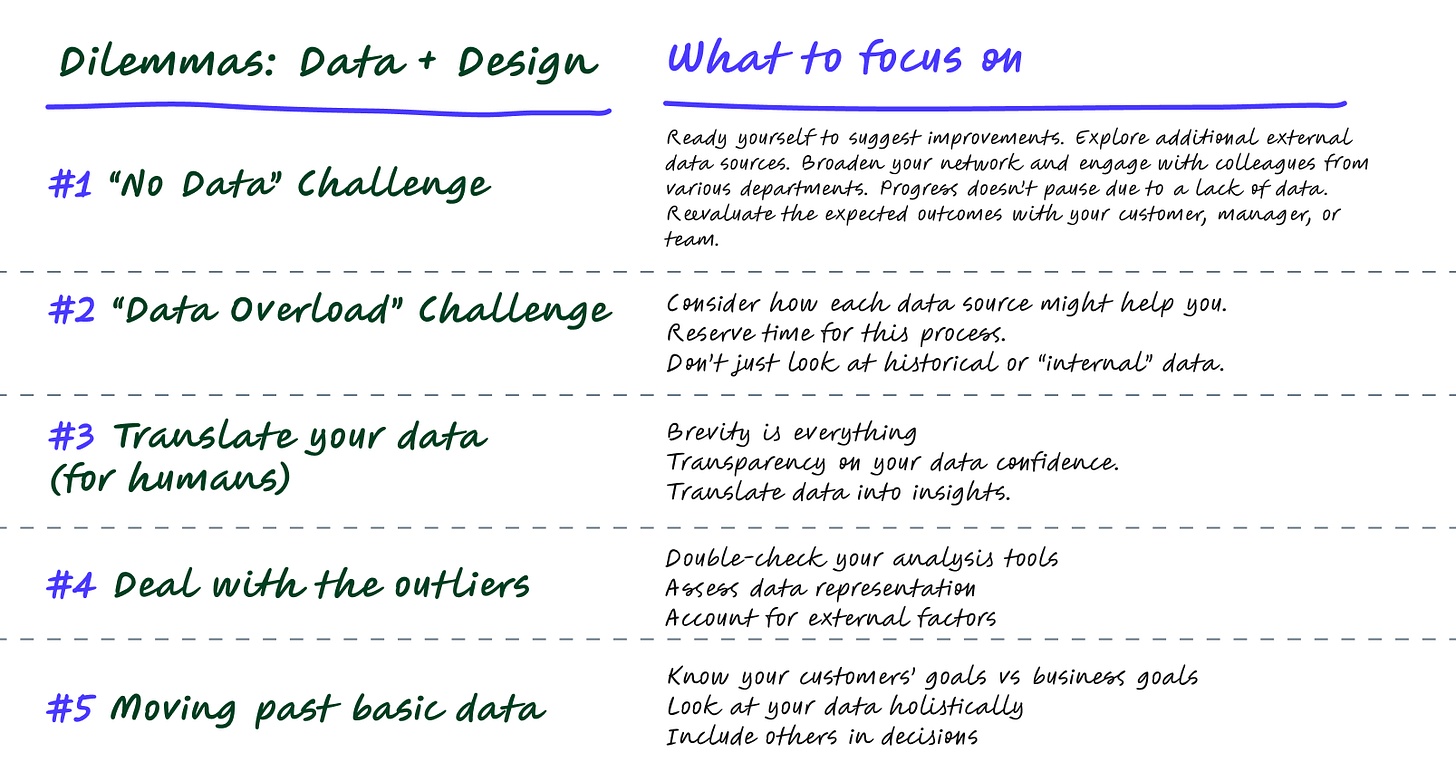
We’re going to dive into a list of challenges & advice:
What to do when you have “No data.”
What to do when you have “Too much data.”
How to translate your data into insights.
What if there are outlier data?
How to move past Amplitude/Google Data?
The Design-Data Dilemma Sheet
Before we get into the weeds, let’s define a couple of terms that will come up frequently: 'data' and 'insights.” Consider data as the raw numbers and insights as the interpretations that transform those numbers into actionable wisdom.
Now, let’s jump into the deep end.
1. “No Data” Challenge
Have you ever faced the problem with “no data?” In many organizations, the capacity to generate and utilize data to guide design efforts varies widely. Designers often navigate ambiguous scenarios well. However, designs crafted without a clear understanding of who they are for or without a consensus on expected outcomes and actual behaviors can end up feeling dull and disjointed.
Ready yourself to suggest improvements. If enhanced data access would advance your design processes, consider what steps your organization might take to facilitate this.
Broaden your network and engage with colleagues from various departments. You might find another team has the needed data or shares your challenges. For new external partners or those in organizations with rigid silos, it’s essential to establish trust and build rapport first.
Explore additional external data sources. Consider leveraging external research or statistical data to better understand the context, your customers, or emerging industry trends.
Progress doesn’t pause due to a lack of data. Clearly outline your assumptions and strategize their validation. Starting with robust qualitative insights might be wise, as these can significantly influence and define the success of your design.
Reevaluate the expected outcomes with your customer, manager, or team. You may discover that the design specifics can't be as finely tuned as initially thought. This flexibility, however, enables a deeper understanding and exploration of viable design paths.
2. Data Overload
If you are fortunate enough to have plenty of materials and sources to explore, your main concern might be managing your time efficiently.
Consider how each data source might help you. Allocate your time accordingly. You might have a few critical questions in mind or want to check if anything new or unexpected jumps at you.
Collaborate with your analysts or industry experts to analyze the data together. Clear your interpretations and hypotheses, engage in discussions, delve more deeply, and note any further inquiries that need exploration.
Reserve time for this process. Simply reviewing data is one step; making sense of it is entirely another. Engage with the data, refine it, and cross-reference it to uncover prominent and subtle insights. Expect this to take longer than anticipated, but the effort is worthwhile.
Don’t just look at historical or “internal” data. It’s good to respect and use existing findings (as anyone who has ever created an insights report or set up a reporting channel might wish). Yet, design rarely happens in a laboratory. Prototype, go out, test, and consider whether the previous findings still apply in the new set-up.
3. Translate your data (for humans)
The best advice I’ve heard from ADPList Mentors while struggling with a report was this: “You’ve been hired to consult, so do the consulting.”. Blunt? Perhaps, but a needed reminder that actionable insights are better than a piece of information is on its own.
Brevity is everything. Be concise. Use data visualization (graphs, charts, mockups, etc.). Make your key takeaways visible in a TLDR. Not only will this approach be more memorable for your audience, but crafting these statements will ensure you’ve done the hard and valuable work.
Transparency on your data confidence. Provide an introduction and footnotes to enable others to make their estimations. While industry or design-driven studies may not have the same research standards as academia, it is beneficial to familiarize yourself with criteria such as sample size and bias. This will enable you to make informed decisions based on research findings.
Translate data into insights. Be it a concept prototype, a customer profile, a list of recommendations, a roadmap, or a strategy… indicating what a piece of data means and displaying how it might be used paves the way for action. This is where your intuition and professionalism as a designer should shine.
4. Deal with the outliers
When you look at data, it might not make sense to you. You might wonder why it is like that. In such cases, you may try to figure out how it fits in with everything else.
Double-check your analysis tools. Sometimes, overlooked modifications in filters or settings can lead you astray. If problems persist, put on your detective hat and delve deeper.
Assess data representation. For example, consider whether your customer effort surveys or net promoter scores capture the views of all potential customers or just those who have recently completed a successful interaction. Are you examining a moment or identifying trends over a more extended period? Check for consistency across different demographics and conditions.
Account for external factors. Was there a media event that spiked visitors? Or perhaps a holiday season that altered regular consumer behaviors? Consider whether recent updates might have disrupted user processes.
Challenge your assumptions (always). If results aren’t as expected or desired and if there's disagreement over their interpretation, gather more data. Cross-reference findings and use observations and interviews to dig deeper. The objective is to learn and adapt, not just confirm pre-existing notions.
5. Moving past basic data
Tools such as Amplitude are excellent for supplying simple metrics like averages and extremes but remember, "the average customer" is a myth. Even though data is more accessible than ever, it still requires diligent effort to develop a deeper and more nuanced understanding of it.
Know your customers’ goals vs business goals. Think about how similar or different your customers are. Which differences matter for what you’re trying to achieve? Try to group them in ways that make sense for your work. Designing for different types of customers can be tricky, but it’s also exciting—a great challenge for anyone!
Look at your data holistically. How big are the changes you’re seeing in it? It might be hard to tell if a change is big or small without something to compare it to. Try looking at your data compared to last year’s, against the total number of customers, or against the size of the market. Even if you use simple graphs, understanding how you present data can change how it looks and feels.
Include others in decisions. When making decisions based on your data, bring in different people like customers, your boss, or team members. They can offer new ideas and help you see things from different angles. This isn't just about having numbers; it's about everyone learning and making better decisions together based on what the data tells us.
Conclusion
Start experimenting and learning more about data to enhance your skills as it becomes increasingly integral to design.
I highly recommend watching this exclusive interview that I did with Julie Zhuo (Former VP of Design, Meta). Save it and watch it today!
Although data and business analysis are well-established, design contributes a fresh, forward-looking perspective by transforming observations into simulations of possible futures. While quantitative data is becoming more prevalent, qualitative insights remain crucial, and the challenge to secure them continues. Think of this as expanding your set of tools or vocabulary as a designer.
I’m curious: what else would you add, or what resonated most with you?
Have a fulfilling and productive week! 🙏
🏕️ Meetups in April 2024
RSVP for ADPList Community-organized meetups happening soon—click the city name to register:
Los Angeles 🇺🇸, April 25th—Thanks to Tomasz Boinski!
Bangkok 🇹🇭, April 26th—Thanks to Pimnara, Agoda team & Felix Lee!
Lagos 🇳🇬, April 27th—Thanks to Faith Oni & ADPList Team!
Syracuse 🇺🇸, May 1st—Thanks to Dianna Miller & Gillian Schneider!
Paris, France 🇫🇷 May 2nd—Thanks to Arnold Kotra!
New Delhi 🇮🇳, May 4th—Mentors-Only Event. Thanks to Shreshth!
Lisbon 🇵🇹, May 3rd—Thanks to Lena Salgansky & Hugo Macedo!
Tampa 🇺🇸, May 9th—Thanks to Hilal Ozkaya!
Houston 🇺🇸, May 9th—Thanks to Helene Dendor!
Singapore 🇸🇬, May 10th—Thanks Pimnara, Felix Lee & Carousell!
Hyderabad 🇮🇳, May 12th—Thanks to Vivek Goel!
London 🇬🇧, May 19th—Thanks to Rijul Narwal & all eco-social innovators!
Phoenix 🇺🇸, May 23rd—Thanks to Liz Magura!
San Diego 🇺🇸, May 23rd—Thanks to ADPList, FoF, & SD Designers!
Central Hong Kong 🇭🇰, May 24th—Thanks to Stephanie Lau!
👉 Can’t find your city? It takes 10 minutes to host (i.e. pick a date and location), and you get to meet awesome people from our community.
I'll keep creating great stuff if you keep reading. I read every reply if you care to reply :). You might get an answer back. (👀 Registrations are now live for Jakob Nielsen’s special keynote on ADPList in May 👉 RSVP here)
Until next week.
Felix Lee